
Calculating Temperature from Resistance
One of the important characteristic of the NTC thermistor is its ability to repeatedly and predictably change its resistance in relationship to its body temperature.
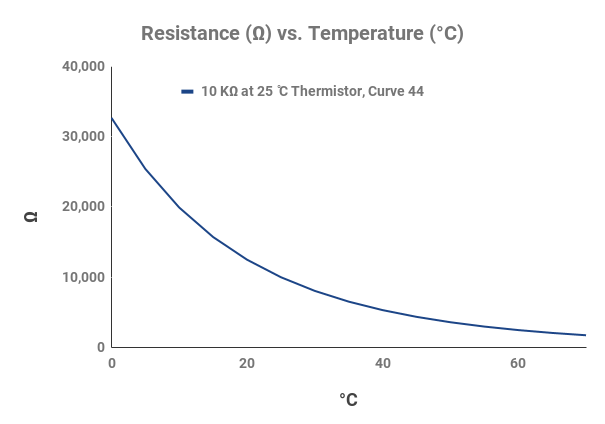
The resistance vs. temperature (R/T) characteristic (also known as the R/T curve) of the NTC thermistor forms the reference “scale” for the device to be used as a temperature sensor. The NTC thermistor R/T characteristic is a nonlinear, negative exponential function.
There are four basic ways the NTC thermistor industry defines the R/T curve characteristics of a NTC thermistor: by the Steinhart-Hart equation, by the Resistance Ratio between two temperature points, the Beta value (β), and/or the Alpha (α) or Negative Temperature Coefficient [NTC] at 25 °C.
Steinhart-Hart Equation
The Steinhart-Hart equation provides excellent curve fitting for specific temperature spans within the temperature range of -80 ̊C to 260 ̊C.

Where: T = Kelvin units (°C + 273.15), A, B, C, D are curve-fitting coefficients, and ln(R) = natural logarithm of a resistance in ohms.
While it has been a common industry approach to eliminate the ln(R)^2 term of the equation, at North Star Sensors we believe, based on published studies, that this practice was based on an oversimplification of the Stein-Hart Hart equation and should only be used over relatively narrow temperature ranges. If you would like additional technical information, please contact us.
To determine the A, B, C, D coefficients for a particular temperature range, the resistance of an NTC thermistor is measured, under zero power conditions, at four temperature points, where T1 is the lowest temperature of the range, T2 and T3 are the middle temperatures, and T4 is the highest temperature of the range. Our favorite method for calculating the coefficients is through matrix multiplication in a spreadsheet. We've built a calculator to help you calculate the coefficients:
Steinhart-Hart Coefficients Calculator - Excel Version
It is important to note that resistances and temperatures for this calculator are limited to specific NTC curves.
Certain precautions need to be taken when using the Steinhart-Hart equation in order for the user to achieve the desired accuracy and uncertainty of the resistance vs. temperature data to be calculated. By understanding the strengths and limitations of the Steinhart-Hart equation, one can optimize the results for a particular application. Listed below are some guidelines which show the amount of interpolation error introduced by the equation for each of the following conditions, where the temperature span over which the R/T data to be calculated is defined by the end points tlow and thigh expressed in units of degrees Celsius (°C):
≤ 0.001 °C error for 50 °C temperature spans within the range of temperatures (t) 0 °C ≤ t ≤ 260°C.
≤ 0.01 °C error for 50 °C temperature spans within the range of temperatures (t) -80 °C ≤ t ≤ 0 °C.
≤ 0.01 °C error for 100 °C temperature spans within the range of temperatures (t) 0 °C ≤ t ≤ 260 °C.
≤ 0.02 °C error for 100 °C temperature spans within the range of temperatures (t) -80 °C ≤ t ≤ 25 °C.
If an application requires a curve fit with the maximum possible accuracy over a temperature span wider than 50 °C or 100 °C, the desired temperature span can be broken down into 50 °C or 100 °C increments for calculation of the A, B, C, D coefficients and resistance vs. temperature data. The resistance ratio (Rt/R25) vs. temperature tables published by North Star Sensors were developed from Steinhart-Hart equation calculations performed over several 50 °C spans, such as -50 °C to 0 °C, 0 °C to 50 °C, 50 °C to 100 °C , and 100 °C to 150 °C.
The specific A, B, C, D coefficients of a thermistor depend both on the NTC thermistor curve and on the R25 of that thermistor. For example, a curve 44 part with an R25 of 10 kΩ and a curve 40 part with an R25 of 10 kΩ will have different A, B, C, D coefficients even though they have the same resistance at 25 °C. Additionally, a curve 44 part with an R25 of 10 kΩ and a curve 44 part with an R25 of 5 kΩ will also have different A, B, C, D coefficients even though they have they have the same curve. However, any part with the same curve and same R25 will have the same A, B, C, D coefficients within it’s tolerance band.
Click here for a few examples of A, B, C, D coefficients by curve and R25
Unlike A, B, C, D coefficients, all thermistors of the same curve have the same R/R25 ratio value. North Star Sensors has published R/R25 ratio tables for each of its thermistor materials. 1 °C R/T tables are also published for common R25 values. Please contact North Star Sensors if you need additional information or R/T specifications.
Click here for more information on North Star Sensors’ temperature curves
Beta (β)
The Beta (β) value of a thermistor is an indicator of the slope of the resistance-temperature curve characteristic and is calculated by measuring the resistance values of the device, under zero power conditions, at two temperature points, typically at 0 ̊C and 50 ̊C. The resistance values are then entered into the following equation:

Where T1 = 273.15 K (0 ̊C) and T2 = 323.15 K (50 ̊C), and R1 and R2 are the resistance (Ω) at the respective temperatures.
The β value is not a true material constant and is temperature dependent. However, it is useful for calculating resistance values over a narrow temperature range. Depending on the temperature span, errors associated with Beta calculations range from 0.01 ̊C error over a 10 ̊C span to 0.3 ̊C error over a 50 ̊C span.
Here are various temperature ranges for β values of North Star Sensors’ curves:
| Curve: | 44 | 35 | 38 | 40 | 43 | 47 |
|---|---|---|---|---|---|---|
| 0 °C / 50 °C β: | 3891 | 3107 | 3407 | 3575 | 3811 | 4142 |
| 25 °C / 85 °C β: | 3978 | 3192 | 3486 | 3694 | 3943 | 4262 |
| 0 °C / 70 °C β: | 3918 | 3132 | 3430 | 3610 | 3850 | 4178 |
| 25 °C / 125 °C β: | 4007 | N/A | N/A | 3746 | 4001 | 4313 |
Resistance-Temperature Ratio
NTC thermistor manufacturers also define their different R/T materials by publishing resistance ratios and ratio tolerances for R0/R50, R0/R70, and R25/R125, whereby “Rt” is the zero-power resistance at the corresponding temperature in degrees Celsius. If a percent ratio tolerance is specified, the percent specified depends on whether the thermistor is used as a broader-tolerance point-matched device or a tight-tolerance interchangeable device.
Here are various ratio values of North Star Sensors’ R/T curves:
| Curve: |
44 | 35 | 38 | 40 | 43 | 47 |
|---|---|---|---|---|---|---|
| 0 ̊C / 70 ̊C Ratio: | 18.65 | 10.38 | 12.96 | 14.82 | 17.73 | 22.64 |
| 0 ̊C / 50 ̊C Ratio: | 9.062 | 5.814 | 6.889 | 7.575 | 8.659 | 10.448 |
| 25 ̊C / 125 ̊C Ratio: | 29.248 | N/A | N/A | 23.474 | 29.098 | 37.850 |
The 1 °C tables for the resistance ratio values for each curve at each temperature can be found on the following page:
North Star Sensors’ Temperature Curves
Negative Temperature Coefficient [NTC]
The temperature coefficient of resistance or alpha (∝) of a thermistor is defined as the ratio of the rate of change of resistance with temperature to the resistance of the thermistor at a specified temperature (T), as shown by the following expression:

Where T = temperature in Kelvin and R = Resistance in Ohms at temperature T.
The alpha value is used to calculate the temperature coefficient of a NTC thermistor at a temperature point.
For NTC thermistors, the alpha or temperature coefficient is expressed in units of a minus percent resistance change per degree Celsius. Due to the semiconducting nature of an NTC thermistor, the temperature coefficient of resistance decreases as the temperature increases and vice-versa. Typically, when used to specify a R/T curve material, the NTC at R25 is used.
North Star Sensors uses the NTC at R25 for each of its R/T Curve materials in its basic thermistor part number in order to make it easier to cross-reference its thermistor products to the industry standard curves. For example Curve 44 has an NTC value of -4.4 %/ ̊C
Because the NTC is different for each temperature point along the R/T curve, interchangeable NTC thermistors are specified to a temperature tolerance rather than a resistance tolerance over a temperature range [i.e. ± 0.2 ̊C from 0 ̊C to 100 ̊C] . Because the temperature tolerance is proportional to the percent tolerance on the electrical resistance at a particular temperature point, the NTC is useful for calculating resistance tolerances expressed in units of percent. The percent resistance tolerance is determined by multiplying the specified temperature tolerance by the NTC of the thermistor at the given temperature point.
NTC (%/°C) × Temperature Tolerance (± °C) = ± % Resistance Tolerance.
For example, to determine the resistance tolerance of a Curve 44 thermistor with a ± 0.2 ̊C tolerance at 100 ̊C, -2.93% / ̊C [NTC @ 100C] × (±0.2) [Temperature Tolerance] = ± 0.586 % Resistance Tolerance.
Here are the NTC values at 25 ̊C for North Star Sensors’ R/T curves:
| Curve: | 44 | 35 | 38 | 40 | 43 | 47 |
|---|---|---|---|---|---|---|
| NTC ∝ (% / ̊C) at 25 ̊C | -4.385 | -3.505 | -3.841 | -4.032 | -4.299 | -4.671 |
The 1 °C tables for the NTC values for each curve at each temperature next to the resistance ratio values can be found on the following page: